


# Bitcoin Halving Cycle 2026: Two Years In, Where It Sits
On April 19, 2024, Bitcoin's fourth halving cut the block reward from 6.25 BTC to 3.125 BTC, dropping fresh daily supply from about 900 coins to 450. Price sat near $63,000 that morning. By October 6, 2025, Bitcoin had printed an all-time high above $126,000, then rolled over into a slow drawdown that pulled the tape back near $63,000 by mid-July 2026, according to Fortune's daily price desk. Twenty-seven months into the cycle, the four-year halving model is being questioned by the same analysts who built it.
Every prior halving produced a parabolic run that peaked roughly 500 days later, then a drawdown of 75% or more. Halving four followed a different shape. Research from Kaiko noted that Bitcoin hit new highs before the April 2024 halving for the first time in its history, a break with 2012, 2016, and 2020. Whether this cycle is late-stage or a new regime is the debate running through analyst notes right now.
In this piece
- What the halving cycle is
- The four halvings in sequence
- Why 2026 is different
- Companion indicators at mid-2026
- Where Ryder One fits
- The bottom line
What the halving cycle is
The Bitcoin halving is a code-enforced supply cut that happens every 210,000 blocks, or roughly every four years. Each halving cuts the reward paid to miners for producing a block in half. The mechanism is baked into Bitcoin's protocol and continues until roughly the year 2140, when the last fraction of a coin gets mined and total supply caps at 21 million.
The four-year cycle theory argues that these halvings drive Bitcoin's boom-and-bust price pattern. The reasoning goes: supply drops by 50%, demand keeps pace or grows, price rises, retail piles in on the rise, price peaks somewhere around 500 days after the halving, then everyone who bought late gets crushed in a bear market lasting most of the following two years. This framework fit the first three halvings closely enough that traders built entire allocation models around it.
The four halvings in sequence
Each halving has its own price arc worth walking through, because the deviations between them matter more than the pattern itself.
November 28, 2012 was the first. Price sat around $12 at the moment the reward dropped from 50 BTC to 25 BTC. Roughly a year later, Bitcoin printed a peak near $1,150 on November 30, 2013, a gain of about 9,000% inside 12 months. That run went on to define what the community meant by "halving cycle."
July 9, 2016 was the second halving. Bitcoin traded near $650 at the block reduction to 12.5 BTC. It climbed steadily through 2017 before topping at roughly $19,700 on December 17, 2017, according to CoinGecko's halving history. The gain from halving to peak came in around 2,900%.
May 11, 2020 was the third. Price sat around $8,700 and the block reward fell to 6.25 BTC. Eighteen months later, on November 10, 2021, Bitcoin peaked near $69,000, a gain of about 690%. The peak-to-peak returns had been shrinking already, but the shape of the run stayed familiar: quiet post-halving months, a slow build through the next twelve, then a fast leg into a top.
April 19, 2024 was the fourth. Bitcoin was already near $63,000, which meant this halving arrived without the accumulation phase every prior cycle had shown. New highs had been printed weeks earlier. By October 2025, Bitcoin reached $126,198 as its cycle-so-far peak, according to Fortune's price desk. The gain from halving to peak: about 100%.
Why 2026 is different
The clean answer is ETFs. Spot Bitcoin ETFs launched in January 2024, three months before the halving. BlackRock's IBIT, Fidelity's FBTC, and the rest of the initial cohort pulled tens of billions of dollars into regulated wrappers within their first year of trading. That flow changed the buyer profile.
Retail-driven cycles produced parabolic tops because the marginal buyer late in a cycle was someone chasing a chart. Institutional flows layer differently. Fund allocators rebalance on a schedule, add on drawdowns, and lock capital for quarters rather than weeks. Amberdata's 2026 outlook argued the ETF era has stretched Bitcoin's run-up and compressed its drawdown, so the peak-to-trough shape flattens over time.
That framing has knock-on effects for cycle timing. If tops are shallower, so are bottoms, and the 500-day post-halving peak becomes less reliable as a signal. Twenty-seven months in, Bitcoin sits below its October 2025 high by roughly half. In prior cycles that reading would place the market deep into bear territory. In this cycle, the debate is whether the drawdown is a mid-cycle reset or the tail end of the whole thing.
Companion indicators at mid-2026
Analysts working around the halving cycle rarely lean on it alone. Companion indicators fill the gap, and their readings in July 2026 tell a coherent story.
The MVRV Z-Score compares market value to realized value, adjusted for volatility. Readings above 7 have marked prior cycle tops within a two-week window; readings below zero have preceded major bottoms. According to Bitcoin Magazine Pro's live chart, MVRV Z-Score sits near 0.49 in mid-2026. That reading is neutral, closer to a floor than a ceiling.
The Puell Multiple compares daily miner revenue in USD against its 365-day moving average. It runs hot near tops when miners are printing money and cold near bottoms when miner economics collapse. Right now the ratio sits well below the danger zone above 3. Reporting from Crypto Times in March 2026 framed this cluster of subdued readings as consistent with a market that has already absorbed most of its top-side excess.
Glassnode's hash ribbons watch the 30-day and 60-day moving averages of hash rate to flag miner capitulation and recovery. Per the Glassnode chart, the 30-day recently crossed back above the 60-day after one of the longest miner drawdowns on record, which historically has coincided with the ending phase of a Bitcoin correction.
HODL waves round out the picture. The share of supply held between six months and two years has been growing all year, which reads as accumulation by holders who bought the late-2025 peak and refused to sell into the drawdown. Long-term holder supply hasn't distributed at the pace prior tops produced.
Taken together, these companion indicators point at a market sitting in a middle zone that shows neither the froth of a cycle top nor the capitulation of a cycle bottom.
Where Ryder One fits
Cycle-position debates matter less than what the holder is planning to do about them. If your read is that this cycle still has a leg higher and you want to be positioned for that upside, the coins need to sit somewhere you control before the move happens. If your read is that the top already printed in October 2025 and you're waiting out the drawdown, the same logic applies. Either read points at self-custody.
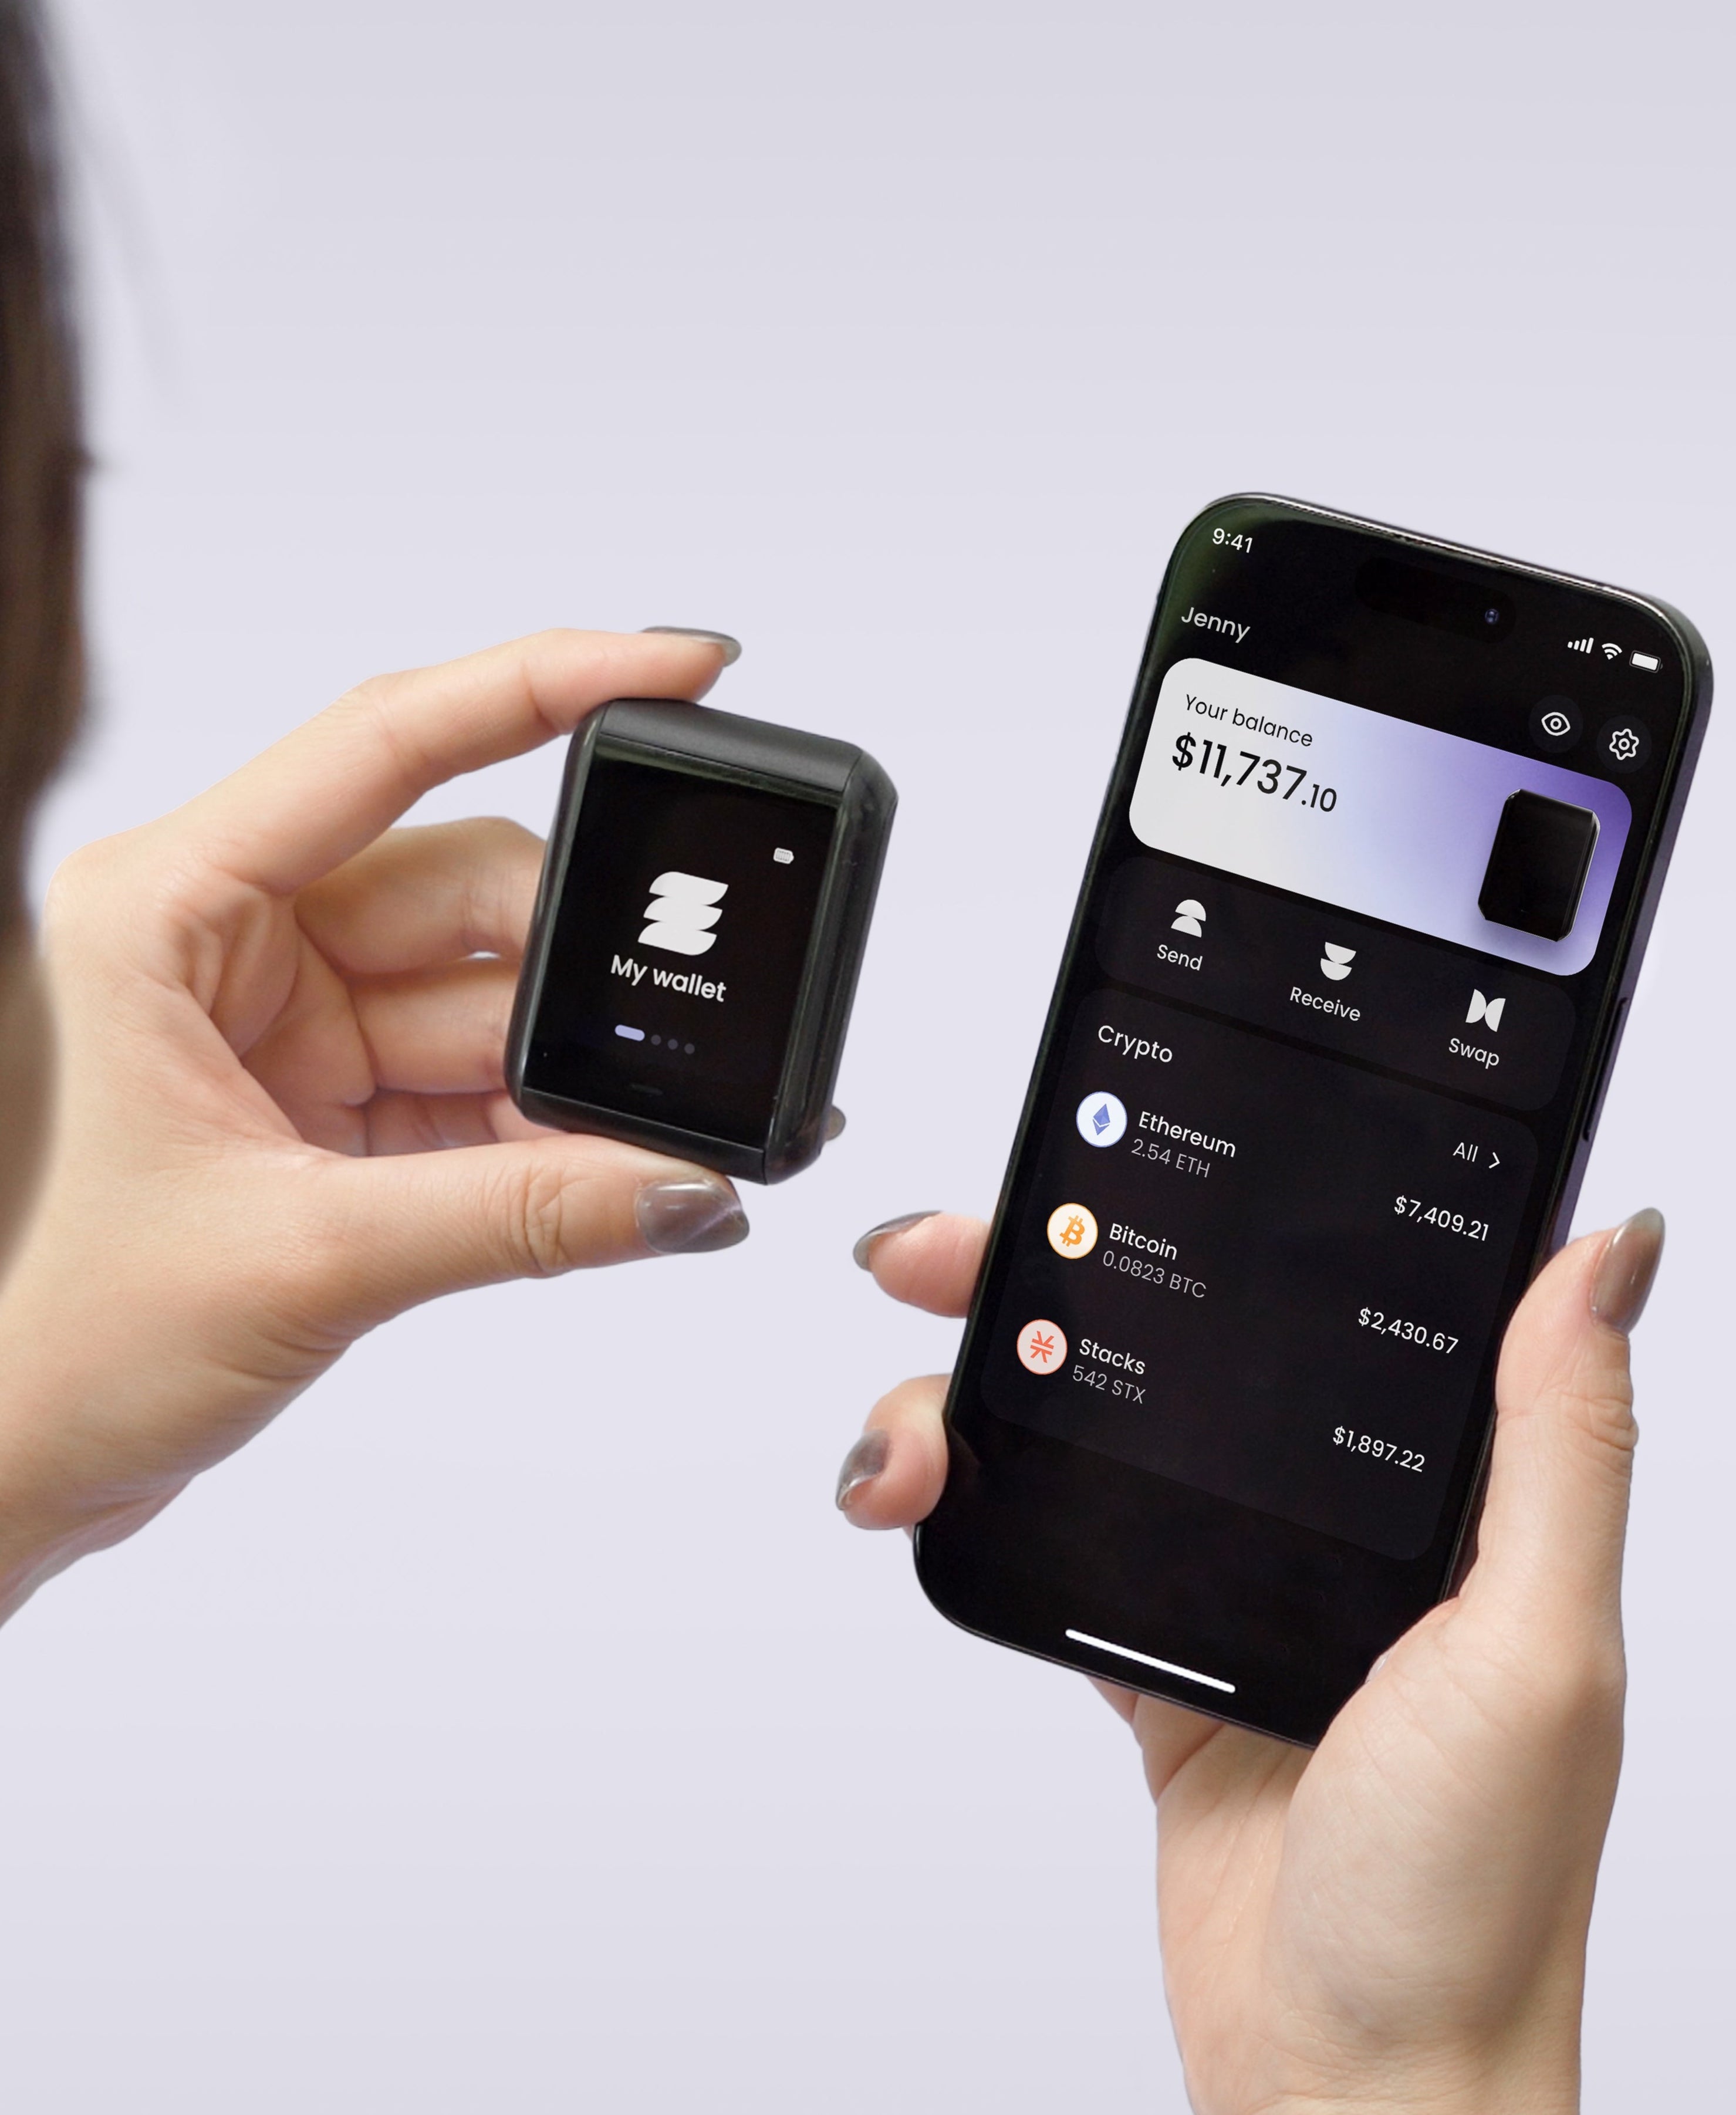
Ryder One holds your Bitcoin keys inside an EAL6+ secure element, and every transaction is verified on the 1.6-inch AMOLED screen before you sign. Fast-tape environments produce the kind of blind-signing risk that hardware verification is built to catch: a wrong address after a copy-paste, a spoofed contract at a moment of hurry, a fee spike quietly baked into a transaction. On-device verification is the layer that catches those before they turn into a loss.
Backup gets handled by TapSafe Recovery, which splits your recovery data across a Recovery Tag and an encrypted phone backup, so each layer holds 50% of the wallet. Tag plus phone equals full recovery, and no single object equals full access. The seed phrase stays available on-device as a last resort and meets the BIP-39 standard, so you're never locked to Ryder hardware. When cycles turn quickly, redundancy in the backup is what keeps a bad session from becoming a lost position.
The bottom line
The Bitcoin halving cycle ran cleanly through three iterations. The fourth broke the mold: ETF flows pulled the pre-halving run into the halving itself, compressed the peak, and stretched the drawdown. Twenty-seven months in, price sits near $63,000, MVRV reads 0.49, Puell looks subdued, and hash ribbons have flipped positive. Whether that reading is late-cycle bottoming or a new baseline that no longer respects the four-year rhythm, the answer isn't in the chart yet.
What the chart won't tell you is how many holders lost coins in the drawdown to exchange failures, wrong-address transfers, or seed-phrase disasters. Those losses show up in the on-chain data as coins that never move again. The piece that matters at cycle turns is the wallet holding the key, because whichever side of the debate is correct, the outcome runs through your own hardware first.
Take the next step
If you're weighing the next move on your Bitcoin position and the coins are on an exchange or a hot wallet, the custody question starts mattering before the price does. Ryder One keeps your keys offline in an EAL6+ secure element, verifies every transaction on-device, and replaces the paper backup problem with TapSafe Recovery. $229, 60 seconds to set up, and no waiting on a withdrawal queue at whatever the market does next.
SEO
- Target keyword: bitcoin halving cycle
- SEO title: Bitcoin Halving Cycle 2026: Two Years In, Where It Sits (55 chars)
- Meta description: The Bitcoin halving cycle turned four in April 2024. Twenty-seven months in, ETF flows have blunted the peak and MVRV reads 0.49. Where it sits now. (150 chars)
- Alt text (hero): Bitcoin halving cycle 2026 chart analysis — Ryder self-custody hardware wallet



Share: